


Tableau: data visualisation that drives your decisions

Discover Tableau, the reference in data visualisation
Tableau is a business intelligence platform that turns your data into interactive visualisations everyone can understand.
Spotting a margin drop on a product line, comparing branch performance on a map, tracking the sales pipeline week after week: with Tableau, you explore your data with drag and drop and get immediate visual answers, without waiting for a report from IT.
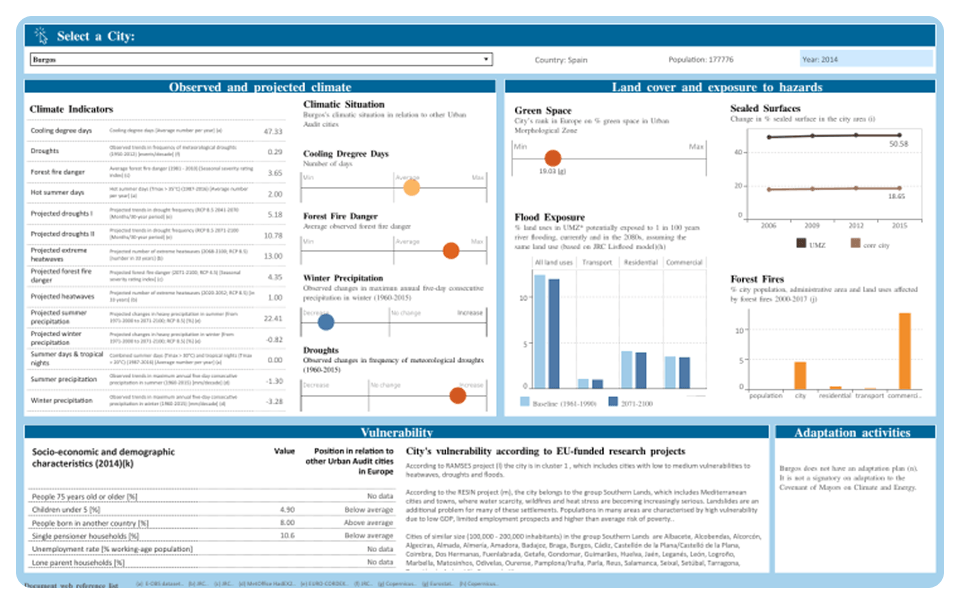
Tableau is built around four functional pillars:
From exploration to distribution, the platform covers the whole analytics cycle.
1. Visual exploration: ask your data questions
The VizQL engine turns every drag and drop into an instant visualisation.
- Explore your data with drag and drop, without writing queries
- Test hypotheses and switch analysis angles in seconds
- Apply trends, forecasts and statistical groupings in one click
- Build advanced visualisations: maps, charts, multi-axis analyses
2. Data connectivity: every source at your fingertips
Tableau connects to your files, databases and warehouses, live or through extracts.
- Connect files, databases and cloud warehouses like Snowflake or BigQuery
- Choose between live connections and performance-optimised extracts
- Prepare and clean your data upstream with Tableau Prep
- Blend several sources within a single analysis
3. Sharing and governance: dashboards for the whole company
Tableau Cloud and Tableau Server distribute your analytics in a secure environment.
- Publish your dashboards for your teams, on the web and on mobile
- Manage access rights and the governance of certified data sources
- Schedule data refreshes and email subscriptions
- Alert the right people when a KPI moves off target
4. Salesforce ecosystem and AI: augmented analytics
As part of the Salesforce family, Tableau keeps gaining AI capabilities.
- Analyse your Salesforce CRM data through native connectors
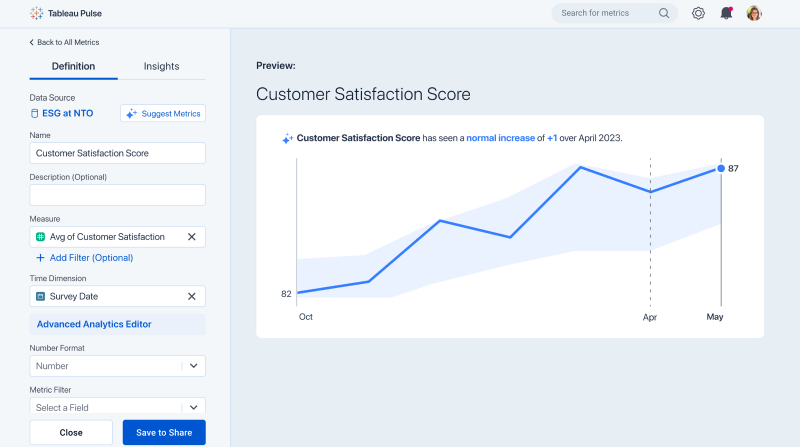
- Automatically receive meaningful KPI changes with Tableau Pulse
- Query your data in natural language with the built-in AI features
- Embed your visualisations in your portals and business applications
Planning a Tableau project? turnK connects your sources, designs your dashboards and trains your teams. Take a look at our Data & AI services or contact us: our consultants reply within 48 hours.
Frequently asked questions.
Tableau is a business intelligence and data visualisation platform. It lets you explore, analyse and share data as interactive dashboards, drawing from many sources: files, databases or cloud warehouses.
Analysts and business teams who want to explore their data visually, and leadership teams looking for reliable dashboards to steer the business. Salesforce customers also benefit from native integration with their CRM.
Drag-and-drop visual exploration, connectivity to many sources live or via extracts, data preparation with Tableau Prep, governed sharing through Tableau Cloud or Server, and automatic insights with Tableau Pulse.
Tableau is sold as a subscription, per user per year, with distinct roles depending on whether you create, explore or simply view analyses. Up-to-date pricing is available on the official Tableau website.
Yes, Tableau is owned by Salesforce and offers native connectors to CRM data, making it a natural choice for analysing pipeline, sales and customer service. turnK makes your data reliable and connected, designs your dashboards and trains your teams on both sides of the project.
