


Power BI: turn your data into decision-ready dashboards

Discover Power BI, business intelligence by Microsoft
Power BI is Microsoft's business intelligence solution, turning your raw data into interactive dashboards to steer your business.
Revenue by region, margin by product, sales performance in real time: connect your Excel files, your CRM or your data warehouse, and your KPIs update automatically. Integration with Microsoft 365 and Teams puts those dashboards directly in your teams' hands.
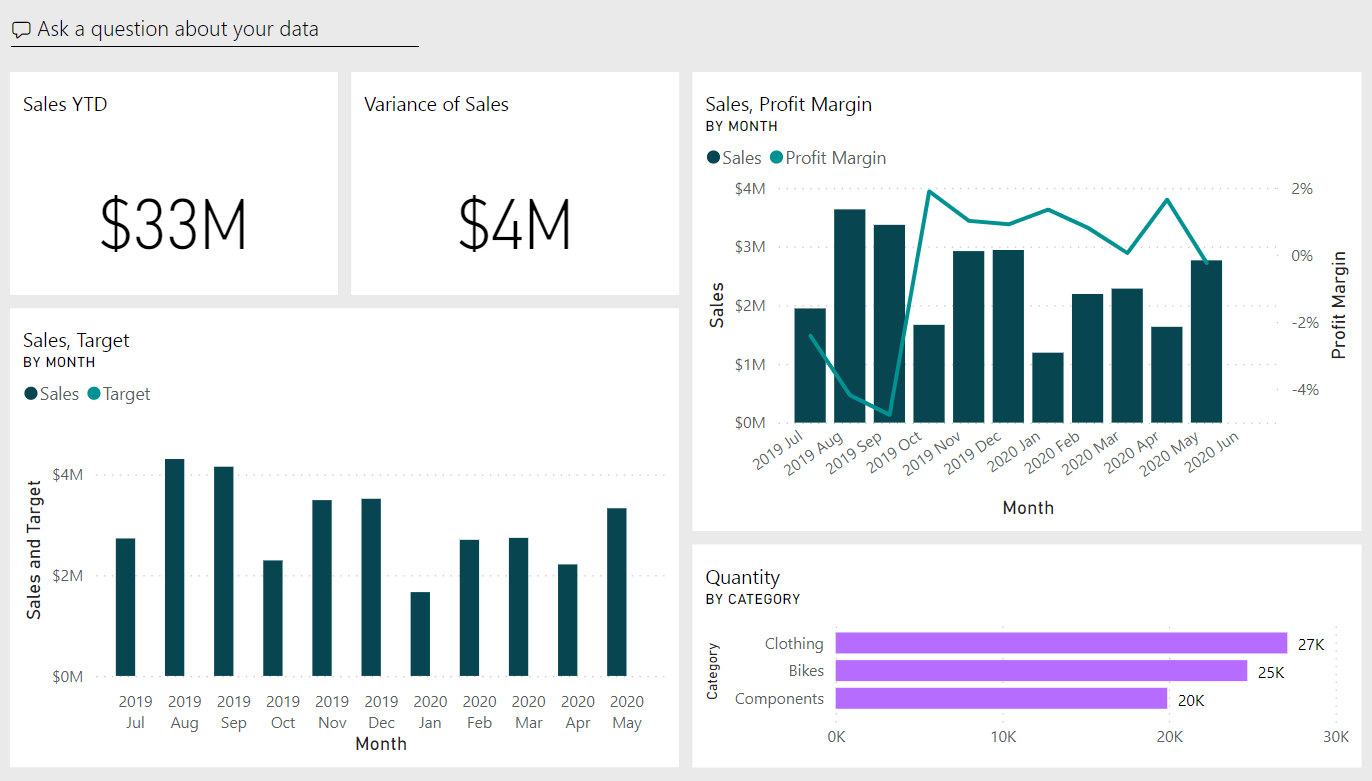
Power BI is built around four functional pillars:
From data connection to report sharing, every step is covered.
1. Data connectivity: all your sources in one place
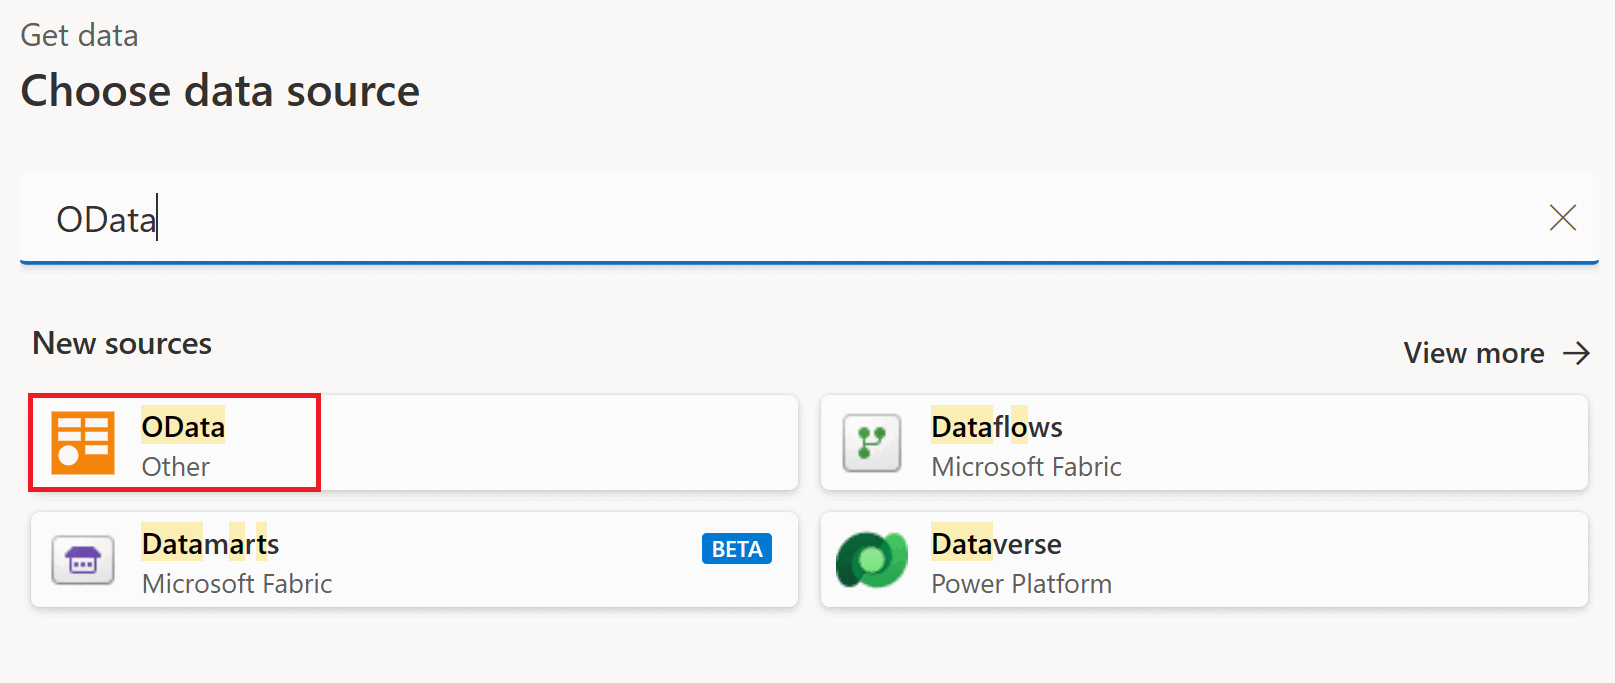
Power BI plugs into virtually all your systems, on-premises or in the cloud.
- Connect Excel files, SQL databases, SaaS applications and cloud warehouses like Snowflake or BigQuery
- Clean and prepare your data with Power Query, without writing code
- Refresh your data automatically at the frequency you choose
- Combine several sources in a single report to cross-analyse your figures
2. Modelling: reliable, consistent metrics
Structure your data so every report relies on the same definitions.
- Build a semantic model linking your tables together
- Create your business metrics with the DAX calculation language
- Define hierarchies and dimensions to navigate from overview to detail
- Reuse the same model across multiple reports to guarantee consistency
3. Visualisation: interactive reports everyone understands
Compose your reports with drag and drop, no technical skills required.
- Pick from a wide library of visuals: line charts, maps, gauges, tables
- Filter and cross-highlight your data in one click with native interactivity
- Drill from consolidated figures down to the individual record
- Adapt your reports for mobile viewing
4. Sharing and collaboration: data in everyone's hands
The Power BI cloud service distributes your reports securely.
- Publish your reports in workspaces shared with your team
- Embed your dashboards in Teams, SharePoint or your own applications
- Manage access rights precisely, down to row-level security
- Get alerts when a KPI crosses a critical threshold
What about artificial intelligence?
With Copilot in Power BI, query your data in natural language and build reports faster. Power BI is now part of Microsoft Fabric, Microsoft's unified data platform, alongside the Azure ecosystem.
Planning a Power BI project? turnK connects your sources, models your data and builds your dashboards. Take a look at our Data & AI services or contact us: our consultants reply within 48 hours.
Frequently asked questions.
Power BI is Microsoft's business intelligence solution. It connects data from a wide range of sources, models it, and turns it into interactive dashboards and reports shared across the company.
Business teams as well as analysts: reports are built with drag and drop, while the DAX language covers advanced needs. It is a natural choice for companies already running Microsoft 365.
Connectivity to hundreds of data sources, data preparation with Power Query, modelling with DAX, interactive report building, secure sharing through the cloud service and natural-language querying with Copilot.
Power BI Desktop, the authoring tool, is free. Sharing reports requires per-user or capacity-based licences, billed as a subscription; up-to-date pricing is available on the official Microsoft website.
Power BI often wins in Microsoft environments thanks to its native integration and accessible entry cost; Tableau is renowned for the refinement of its visualisations. turnK deploys both and helps you choose based on your ecosystem and use cases.
